6.5 The HBV model
The HBV (Hydrologiska Byråns Vattenavdelning) model is a conceptual rainfall-runoff model which is suitable for many snow-fed river catchments (Bergström 1980; Lindström et al. 1997). You have studied the short description of the HBV model in the RS Minerve technical manual (Garcia Hernandez et al. 2020). Keep these 4 pages at hand for the following exercises so you can look up how the parameters influence the flow of water through the HBV model. A brief reminder of the HBV model implemented in RS Minerve is given in Figure 6.10. The model consists of a snow function which separates precipitation into solid and liquid parts and manages melting of snow and 3 storage reservoirs similar to the linear reservoir we saw in the recap section.
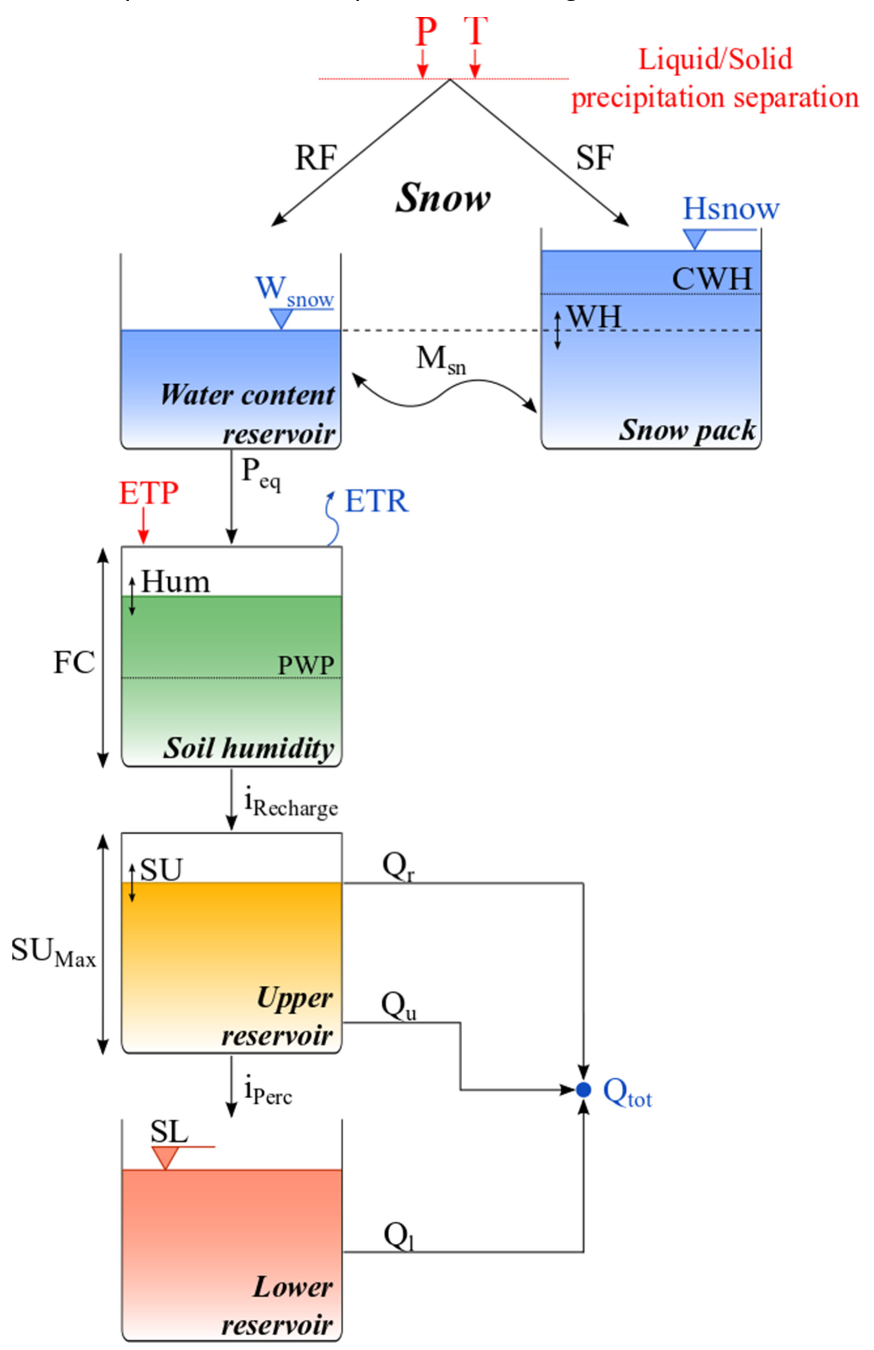
Figure 6.10: The HBV model concept (source: RS MINERVE Technical Manual).
E4.3
Model understanding - Drivers
Discuss with your colleague(s): What are the model drivers (i.e. what input data do you need to provide)?
Hint: Study the figure above.
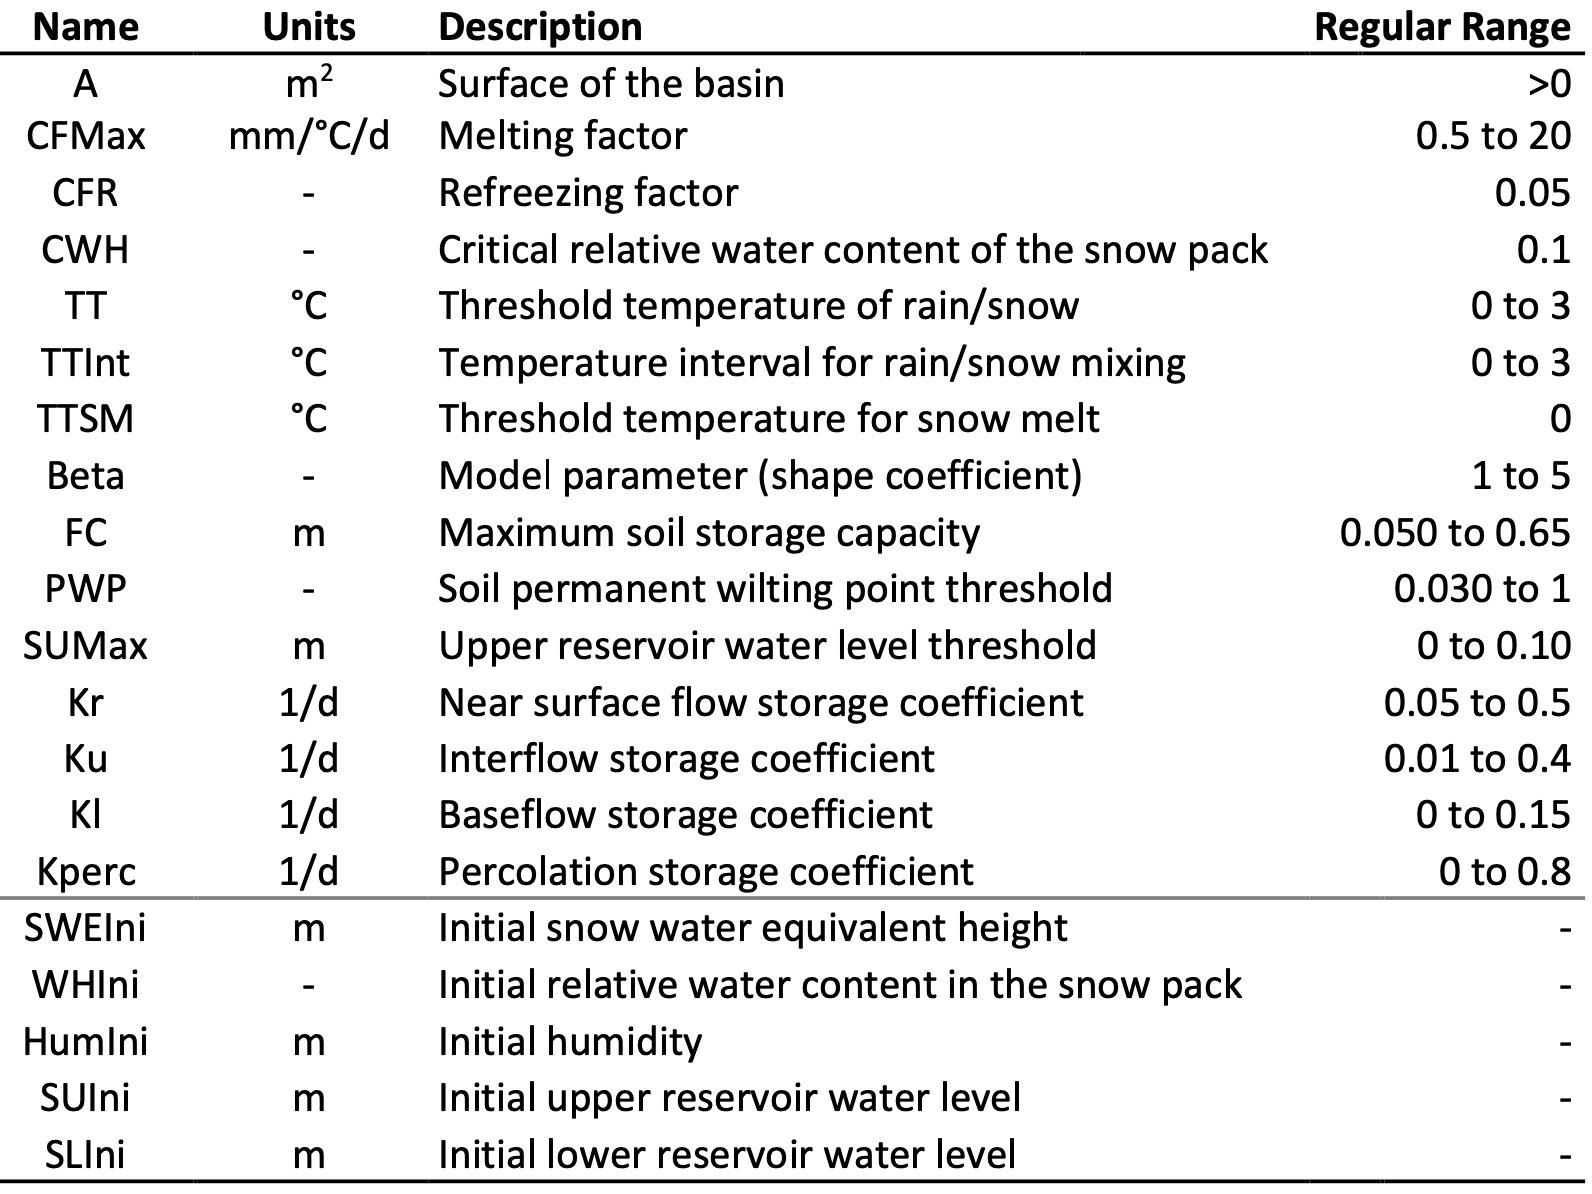
Figure 6.11: The HBV model parameters (source: RS MINERVE Technical Manual).
E4.4
Model understanding - States
Discuss with your colleague(s): What are the model states (i.e. what variables describe the amount of water in the system over time)?
Hint: Values for initial water content in the different model compartments need to be defined prior to the simulation.
6.5.1 HBV example: Simple model of the Nauvalisoy river catchment
6.5.1.1 Set up the model
- Open RS Minerve and create an HBV model with the correct area (Step-by-step guide).
- Add a climate station and link it to the HBV model (Step-by-step guide) .
- Climate data has been prepared in the file ./data/SyrDarya/Chirchiq/RSMinerve/ERA5_Nauvalisoy_1981_2013.csv. Import the data in RS Minerve and link it to the station data (Step-by-step guide).
- Change the model settings to calculate evaporation using Turc and adapt the coordinates in the settings tab Step-by-step guide.
E4.5
RS Minerve - Data visualization
Use the Selection and plots tool in the Modules toolbar of RS Minerve and display the hourly model inputs precipitation and temperature for the example year 1984. What is the approximate temperature range over the year? What is the annual precipitation?
Hint: Adapt the simulation period in the model tab accordingly. Do not forget to set the initial conditions of the model to the last hour of 1983.
E4.6
RS Minerve - Compare evaporation models
Compare the different methods to calculate hourly evaporation in 1984 and their impact on the simulated discharge. Is the uniform evaporation model suitable for seasonal discharge models? In what circumstance could a uniform evaporation model be appropriate?
Hint: Export simulation results to the data base (Solution