6.2 Recap: Hydrological response
Why do we do hydrological modeling? Typically we want to know how much river flow we can expect at a given time in the future so we can plan our water consumption ahead, harness against floods or implement measures against droughts. So how can we forecast river discharge? For example, one could use the long term seasonal average discharge as the likely future discharge. However, in some years we have high discharge and in some years we have low discharge (Figure 6.2). How to tell when you have which discharge?
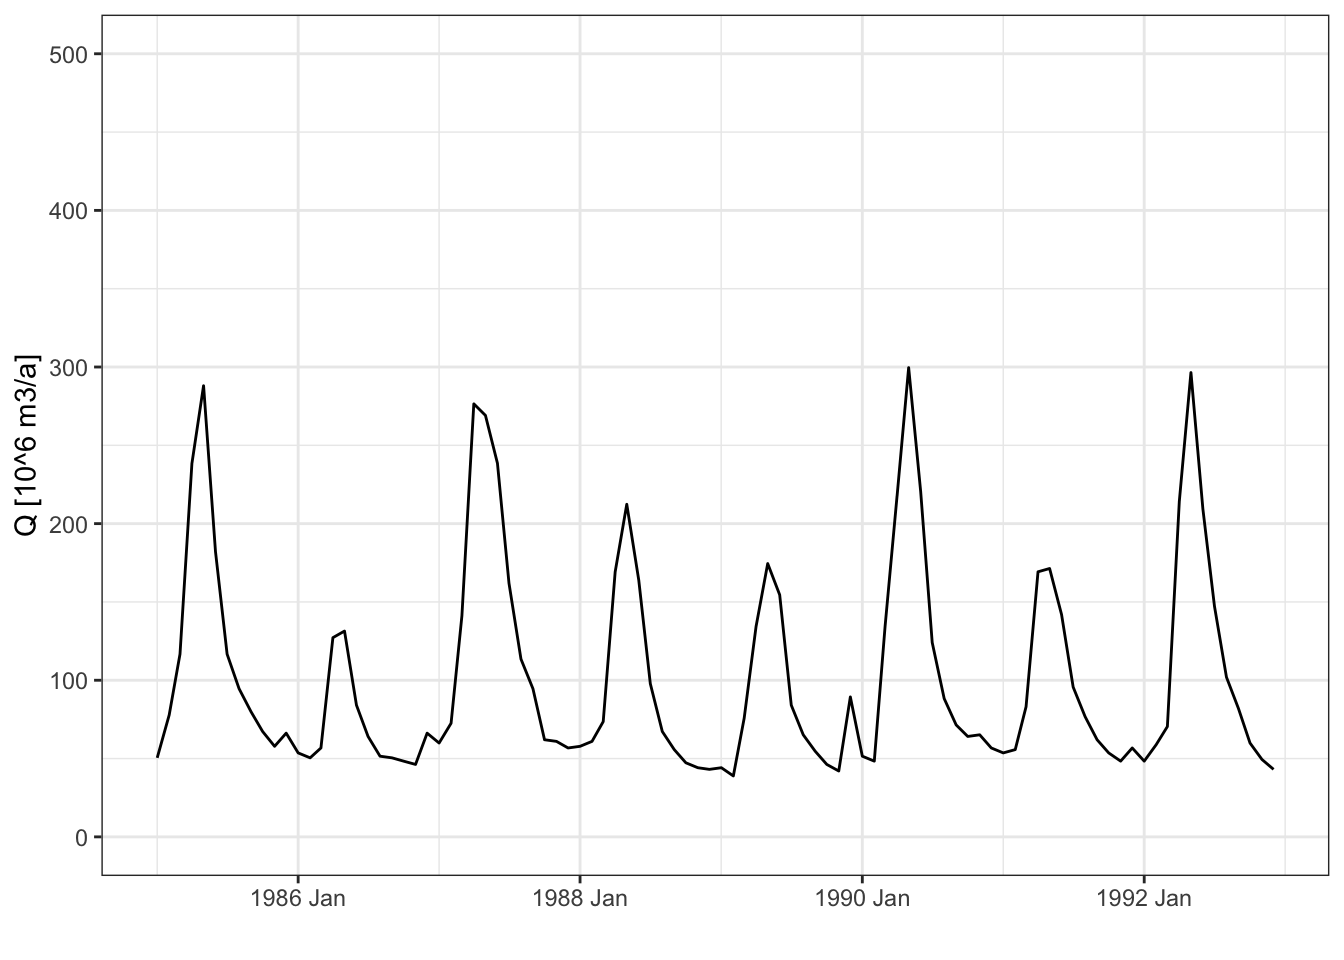
Figure 6.2: Discharge of the Nauvalisoy river.
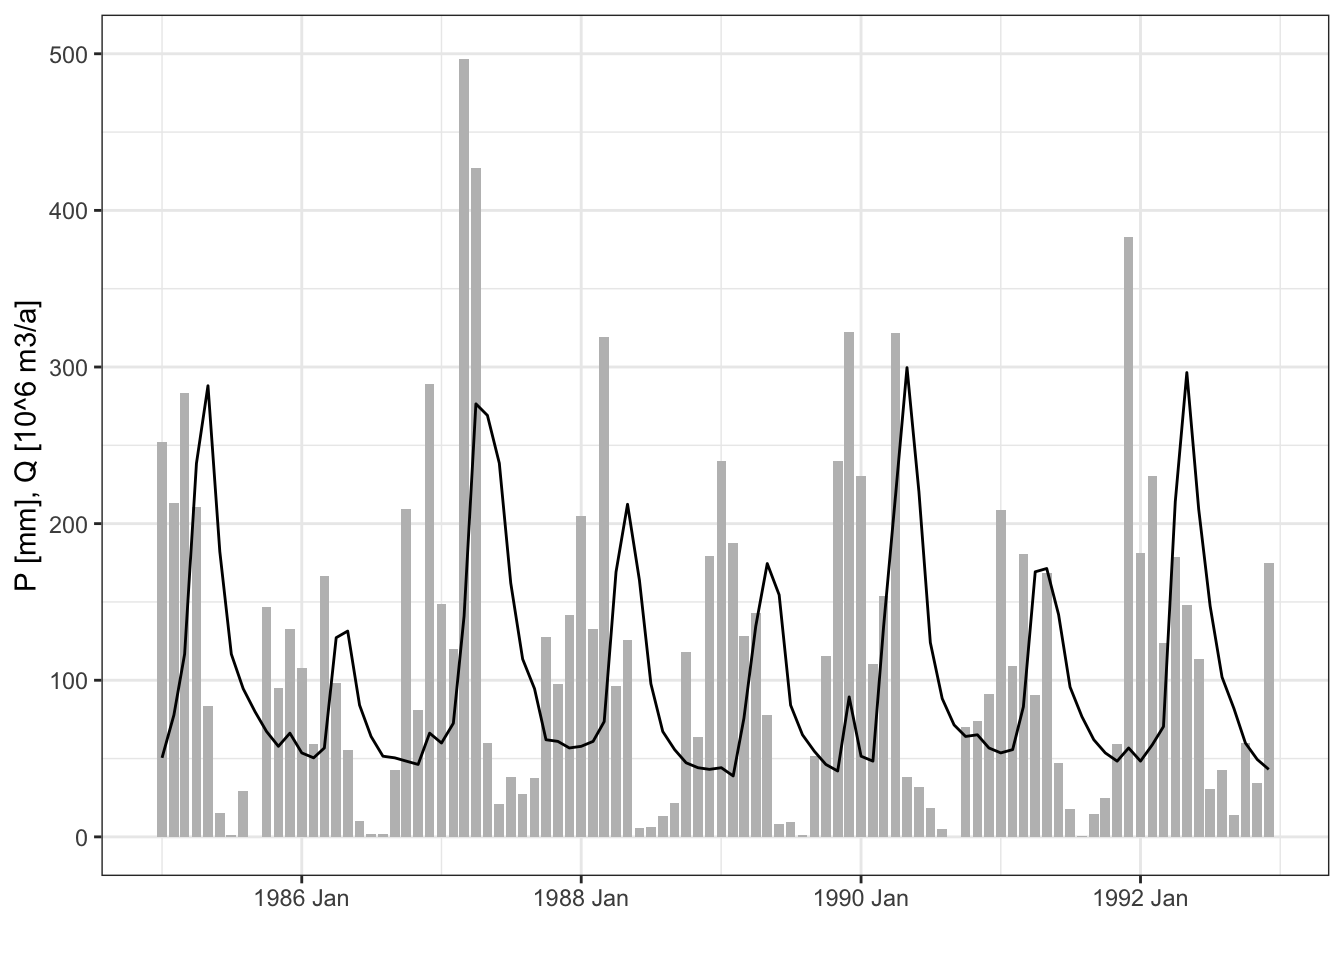
Figure 6.3: Discharge (red) and precipitation (grey) in the Nauvalisoy catchment.
Higher precipitation in the catchment is positively correlated with higher discharge in the river with a delay. Or in other words: The discharge is the catchments hydrological response to precipitation. The relationship is can be expressed as follows:
\[ Q \propto P \cdot K \]
In words this reads: Discharge (Q) is proportional to precipitation (P) times a transfer function (K) that defines the delay of the signal. The transfer function K describes how precipitation becomes river discharge and depends on the catchment characteristics, importantly on the storage capacity of the catchment. In reality, the transformation of precipitation to discharge is quite complex but we can simplify the reality and come up with a basic conceptual model of our river catchment: a large bath tube with the area of the catchment and an outlet at the bottom called the linear reservoir model (Figure 6.4).
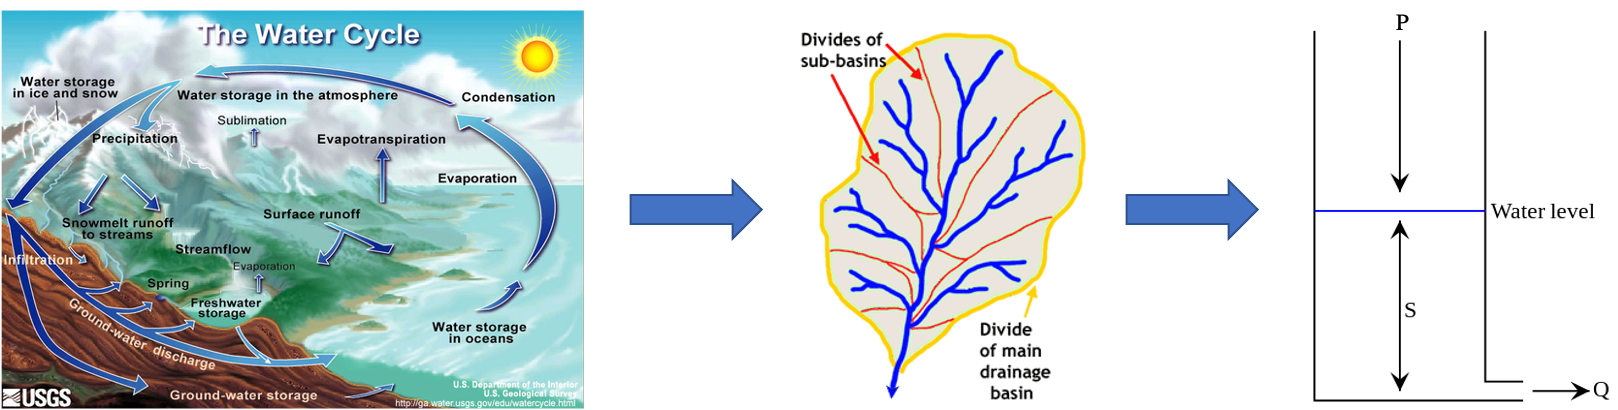
Figure 6.4: From the real-life system (left) to a linear reservoir (right).
The linear reservoir model describes the discharge from the reservoir as linearly proportional to the storage in the reservoir:
\[ Q(t) = 1/k \cdot S(t) \]
Where Q is discharge, S is the storage and k is a constant called storage coefficient depending on the storage capacity of the reservoir. If k is small, the stored water will run out quickly, if k is large, the stored water will run out slowly. (t) indicate time dependent variables, i.e. variables that change over time.
Substitute the linear reservoir equation into the water balance:
\[ P = Q + dS/dt \Leftrightarrow P = Q + k \cdot dQ/dt \]
Where P is the excess precipitation, i.e. the precipitation that is not intercepted by plants or ponds but contributes to discharge. The above is a differential equation and can be re-arranged:
\[(P-Q) \cdot dt = k \cdot dQ\]
and integrated and solved for Q(t) (dig out your mathematics!). In the example in the box below we discredited the water balance with the linear relationship between discharge and storage change in the reservoir:
\[\frac{P_{t_1}+P_{t_1}}{2} - \frac{Q_{t1}+Q_{t_2}}{2} = \frac{k}{t_2-t_1} \cdot (Q_{t_2}-Q_{t_1})\]
and solved the equation for \(Q_{t_2}\) (Inspiration from Pedersen, Peters, and Helweg (1980)).
We assume that at the beginning of our experiment, we don’t have a discharge as the bucket is empty.
\[Q(t) = P(t) \cdot (1-e^{(-t/k)})\]
This is the equation for the rising discharge curve. Once you turn off the recharge of the reservoir (once you stop pouring water into the bucket), the discharge from the bucket can be described as:
\[Q(t) = Q^* \cdot e^{-\tau/k}\]
Which describes the receding limb of the hydrograph (What is a hydrograph) with \(\tau\) being the time since the recharge stopped.
Understanding the linear reservoir model is a prerequisite for hydrological modeling. That is why we propose the following exercise for you to do at home as a preparation for class.
Ex4.1
Exercise: The Linear Reservoir
Part 1: Experimental setup
To understand the flow of water through a reservoir, you will build a bucket model yourself at home from materials that you have at hand and measure recharge as well as discharge from the bucket. You will then make a numerical model of your real bucket model and simulate discharge. Think through the experiment and answer the following questions:
- What will determine the flow through your bucket?
- What do you need to measure?
- How can you measure it?
- What materials you will need to set up the experiment?
- Where will you get the water from and can you re-use it after the experiment?
Part 2: Perform the experiment
Set up the experiment and pour water into your improvised reservoir. Take care to pour with a continuous speed over a short time period. You may have to repeat the experiment a few times (see also notes on measurement accuracy in the solutions of part 1 of this exercise. The outcome of the experiment is a time series of discharge measurements.
You can watch a video of the experiment here if you cannot perform the experiment yourself.
Part 3: Simulate the experiment
The figure below shows the measured discharge from the experimental data shown in the table above. We have implemented a discretized version of a linear reservoir model for you which shows the simulated discharge (grey bars) of a recharge event (blue bars). Play with the storage parameter by moving the slider and see how the simulated discharge changes based on the storage parameter of the simulated catchment. Can you reproduce the measured discharge? If you cannot find a perfect match between measurements and simulation results: What could be the reasons? (If you see an empty window below this text, go to the web app directly to do the exercise).
App code available on GitHub.
E4.1
Non-linear reservoirs
Discuss with your colleague(s):
- What happens to the discharge curve if the outlet of the reservoir is not at the bottom but somewhere in the middle of the receptacle wall?
- What do you need to measure?
- What happens if the receptacle is filled with sand?
- What happens if you add another linear reservoir to the outlet of the first one, i.e. make a cascade of linear reservoirs?